20 Aug 2014
|
Working for our part of Rural England with the Rural Services Network |
|
|
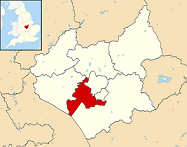
Location: East Midlands Population: 97,700 (2016) Interesting fact: During World War II Braunstone Park was used as a military camp for both English and American personnel. After the war, up until 1950, the nissen huts were used to house families before permanent homes could be found for them.
|
||||
| Blaby |
Blaby is a member of the Rural Services Network and falls |
||||
Blaby Information |
||
| Phone number 0116 275 0555 |
Website www.blaby.gov.uk |
Local Enterprise Partnerships (LEPs) Leicester and Leicestershire |
| Frequency of elections Elections are of whole council |
Number of councillors 39 |
Political composition Conservative Party – 29 Labour – 6 Liberal Democrats – 4 |
| MPs Charnwood – Edward Argar (Conservative) South Leicestershire – Alberto Costa (Conservative) |
Decision making structure Leader and a Cabinet |
Population change Population change One Year Population Change + 0.7% Ten Year Population Change + 5.3% |
| Police Authority Leicestershire Police Authority |
Fire Service Leicestershire Fire and Rescue Service |
Health Authority East Midlands Strategic Health Authority |
| Area 13,054 Hectares |
Rural Output Areas 61 rural OAs from 300 OAs in total |
Audited by Pricewaterhouse Coopers (England & Wales) |
| Rural Classification (Defra) Urban with City and Town |
Population by Area- (Density) 7.40 people per hectare |
Number of Parishes 24 |
| Number of Parish Meetings 5 |
Number of Parish Councils 18 |
Number of Town Councils 1 |
| Average house price £176,000 (Median price paid by local authority, year ending Q4-2015 – provided by UK HPI data published by Land Registry © Crown copyright 2016) |
Outsourced Services Information yet to be supplied |
Average age of population 40.9 (2011 Census data) |
| Main Towns / Cities Braunstone, Leicestershire |
Unemployment rate 0.4% (JSA claimants for August 2017) |
Current Council Tax (amount reported is the amount received by the Council – no other services are included) 2014/2015 Council Tax – £140.52 2015/2016 Council Tax – £143.32 2016/2017 Council Tax – £148.32 2017/2018 Council Tax – £153.32 |
| Percentage of households socially rented from council or local authority 1.9% (2011 Census data) |
Percentage of population who have reported they are in very good health 47.5% (2011 Census data) |
Percentage of population which provides unpaid care 11.2% (2011 Census data) |
| Employment by Occupation Percentage of people aged 16 and over who are in Social Major Group 1-3 41.5% (ONS annual population survey – April 15-March 16) |
Average annual wage for full time employees
|
Percentage of those employed in full time employment 42.6% (2011 Census data) |
| Cars or vans owned per household (2011 Census data) No cars or vans – 13.0% 1 car or van – 42.3% 2 cars or vans – 34.4% 3 cars or vans – 7.7% 4 or more cars and vans – 2.6% |
Local Newspapers Information yet to be supplied |
National Park/AONBs None |
2015 English Indices of Deprivation analysis tool
|
||

(All factual information on these pages is updated annually by the RSN)
(Information given via links will however be updated as new information becomes available)